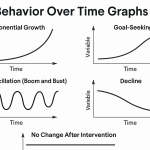
Systems Thinking is all about seeing the bigger picture. We have already talked about how Behavior Over Time Graphs (BOTGs) help us see patterns. But to understand why those patterns happen, we need another tool: the Causal Loop Diagram, which is often called a CLD.
CLDs help us uncover the hidden feedback loops that drive behavior in a system. They don’t just show what is happening; they reveal how different parts of a system work together to create recurring problems or opportunities.
What is a Causal Loop Diagram?
A Causal Loop Diagram is a simple drawing that shows how different parts of a system affect each other. It is a way to map out the connections and see the whole story of a problem.
- Variables are the key parts of the system you are watching. They are placed in a circle and labeled, like “Sales,” “Morale,” or “Customer Satisfaction.”
- Arrows connect the variables to show a relationship of cause and effect. The arrow points from the cause to the effect.
- Each arrow has a sign to show the type of relationship.
- (+) Positive: When one variable goes up, the other also goes up. (Or when one goes down, the other goes down.) For example, as Sales go up, Revenue also goes up.
- (–) Negative: When one variable goes up, the other goes down. This is an inverse relationship. For example, as Customer Complaints go up, Customer Satisfaction goes down.
When the arrows connect in a circle, they create a feedback loop. These loops are the heart of Systems Thinking because they show how a cause eventually becomes an effect and influences itself.
Two Types of Feedback Loops
There are two basic types of feedback loops that you will find in any system. You can see them clearly with a CLD.
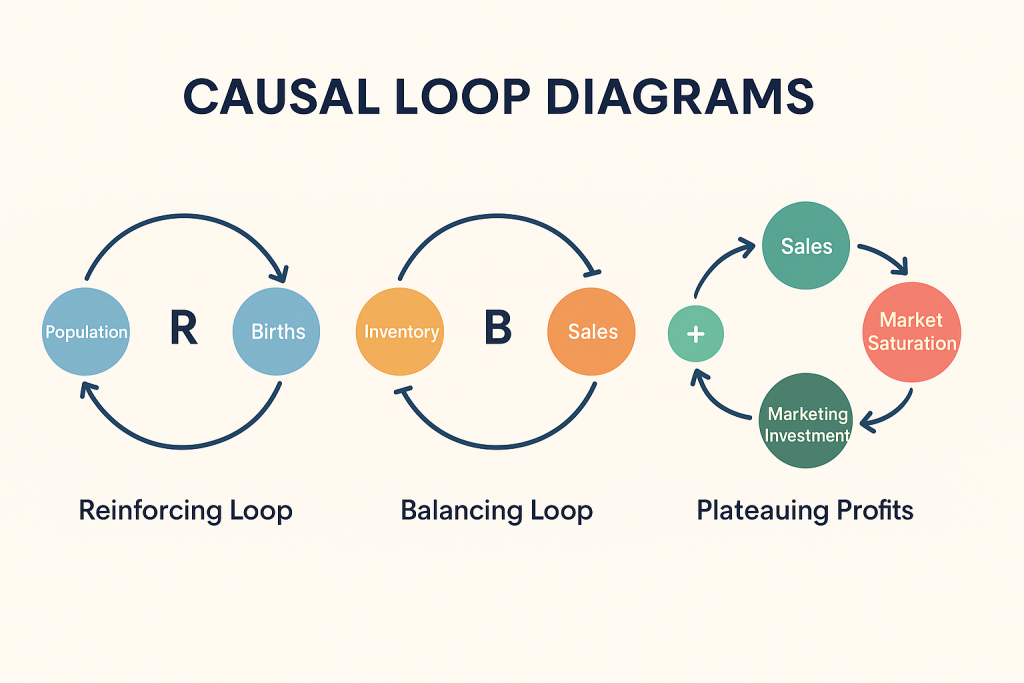
Reinforcing Loops
A reinforcing loop makes a change grow stronger and faster over time. It can be a good thing or a bad thing. Think of it as a snowball rolling downhill—it gets bigger and faster the more it rolls. These loops are a source of exponential growth or a rapid decline.
- Example (Good): The more people share a viral video, the more people see it. This leads to even more people sharing it, which creates a huge, fast increase in views.
- Example (Bad): A bank panic starts, which leads to more people taking their money out of the bank. This makes the bank weaker, which makes the panic even worse. This is a negative reinforcing loop that can lead to collapse.
Balancing Loops
A balancing loop works to stabilize a system. It is a force that resists change and tries to bring a system back to a desired state.
- Example: A thermostat in a room. When the temperature gets too hot, the thermostat turns on the cooling. When the room is cool enough, it turns the cooling off. The balancing loop keeps the temperature stable and on target.
Balancing loops act as limits or controls in a system. They are what keep things from growing or declining forever.
How to Build a Causal Loop Diagram
Building a CLD is a simple process.
- Identify the Key Variables: Think about the problem and decide what matters most. What are the key elements in the system, like sales, morale, or customer satisfaction?
- Draw the Arrows: Show how one variable affects another with an arrow. For example, draw an arrow from “Sales” to “Profit.”
- Mark the Polarity: Use a (+) or (–) sign on each arrow to show whether the effect is positive or negative.
- Close the Loop: See if the arrows connect in a circle. When you trace the arrows, do you get back to where you started? If so, you have found a loop.
- Label the Loop: Put an (R) for a reinforcing loop or a (B) for a balancing loop in the center of the circle.
Important: The goal of drawing a CLD is not to create a perfect diagram. The goal is to better understand the system by revealing the relationships and loops that are causing a problem.
Why Use CLDs?
Causal Loop Diagrams are one of the most powerful tools in Systems Thinking because they give you a clear picture of what is going on.
- They reveal hidden drivers: They show you the true reasons behind a recurring problem, which are often not obvious.
- They reduce blame: They help teams see that the problem is in the system, not in the individuals.
- They point to leverage points: They show you where a small change can make a big, lasting difference.
When you use a CLD, you stop just reacting to symptoms and start seeing the underlying structure.
Frequently Asked Questions (FAQs)
1. Are CLDs the same as flowcharts?
No. A flowchart shows a step-by-step process in a straight line. A CLD shows dynamic feedback and circular relationships. A flowchart helps you get a task done. A CLD helps you understand how a system behaves over time.
2. Do I need data to create a CLD?
No, not always. Many CLDs are built from people’s experience and knowledge. They are a great way to show a team’s shared understanding of a problem. Later, you can test the diagram with real data.
3. Can a CLD predict the future?
Not exactly. A CLD is a model of a system. It can help you anticipate likely outcomes if the system continues to behave as it is now. It shows you the most likely path, but it cannot predict every event.
4. How do I know if a loop is reinforcing or balancing?
You can figure this out by tracing the loop. If you follow the arrows and end up back where you started, ask yourself, “Does this loop make the original change grow or does it try to stabilize it?” For example, if you start with an increase in something and a full trip around the loop brings you back to a bigger increase, it’s a reinforcing loop. If it brings you back to a decrease, it’s a balancing loop.
5. Why is a CLD better than just talking about a problem?
A CLD makes a complex problem visible. It gives everyone on a team a shared picture of the problem, which makes it much easier to have a productive conversation. It helps to reduce arguments and finger-pointing.
6. What is the difference between a (+) and a (–) on a CLD?
A plus sign means that as the variable at the start of the arrow goes in a certain direction (up or down), the variable at the end of the arrow goes in the same direction. A minus sign means they go in opposite directions.
Conclusion
Causal Loop Diagrams are one of the most powerful tools in Systems Thinking. They show us why patterns happen by revealing the loops of cause and effect. Combined with Behavior Over Time Graphs, CLDs give us both the “what” and the “why” of system behavior. Once you learn to draw and read them, you’ll start noticing loops everywhere—in business, in nature, and in your daily life.