We have all heard the famous saying: “The straw that broke the camel’s back.”
Think about the physics of that phrase. You can load 1,000 individual straws onto a camel, and nothing happens. The camel stands still. The system appears stable. Then, you add one single piece of straw—a tiny, insignificant change—and suddenly, the camel collapses.
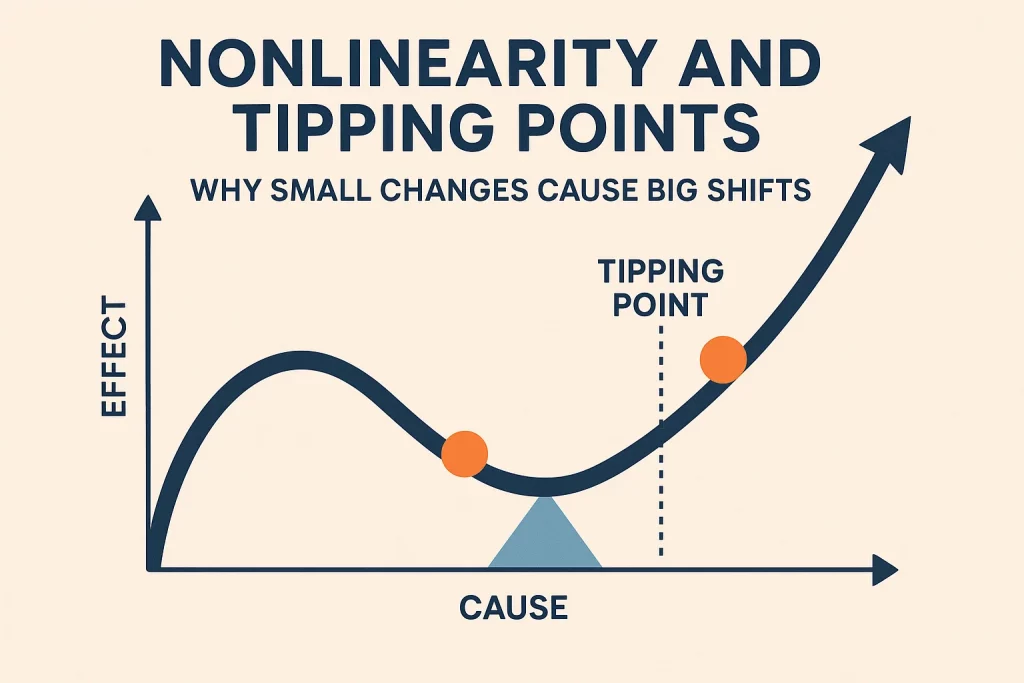
This is the definition of Nonlinearity. In the real world, the relationship between cause and effect is rarely a straight line. Sometimes a huge push creates zero movement, and other times a tiny nudge causes a massive explosion. In System Dynamics, understanding these hidden Tipping Points is the key to understanding why systems suddenly snap.
Understanding Nonlinearity
To understand nonlinearity, we first have to unlearn how we are taught to think. Humans are naturally “linear thinkers.” We assume that Cause equals Effect.
The Linear Illusion
In a linear world, if you double the effort, you get double the result.
- If you eat half as much, you lose weight twice as fast.
- If you push the gas pedal down 10% more, the car goes 10% faster. The graph of a linear relationship is a straight, predictable diagonal line.
The Nonlinear Reality
In a complex system, relationships are curved. The “rules” of the system change depending on the current state of the system.
- Example: If you push a heavy boulder, a light push does nothing (friction is dominant). A medium push does nothing. But once you cross a certain threshold of force, the boulder suddenly starts rolling and momentum takes over. The input (force) didn’t change much, but the output (movement) changed from zero to fast.
The Tipping Point (Thresholds)
The most dramatic form of nonlinearity is the Threshold or Tipping Point. This is the specific moment where the system shifts from one mode of behavior (like stability) to a completely different mode (like collapse).
The Mechanism: Dominance Shift
In System Dynamics books, a tipping point is often described as a Shift in Loop Dominance. This happens when the system switches from being controlled by a stabilizing Balancing Loop to being controlled by a runaway Reinforcing Loop.
- The Erosion Example: Imagine a forest. For years, rain falls, and the trees hold the soil. The system balances itself. But if you cut down just a few too many trees, you cross a threshold. Suddenly, there aren’t enough roots to hold the soil. The next rain washes the soil away, which kills more trees, which lets more soil wash away.
- You crossed the tipping point. The system shifted from “balancing” (stable) to “reinforcing” (collapse).
The Danger of the Cliff
The scary thing about tipping points is that they are invisible until you hit them.
- A boat can tip 10 degrees and rock back. It can tip 30 degrees and rock back. But if it tips 31 degrees (the threshold), it capsizes.
- Policy makers often assume that because the system recovered yesterday, it will recover today. Nonlinearity tells us this is a dangerous assumption.
Saturation and Limits
Nonlinearity isn’t always about sudden collapse; sometimes it is about hitting a wall. This is known as Saturation.
In a linear view, “more is always better.” In a nonlinear system, “more” eventually stops working.
The S-Curve
Most growth in nature follows an S-Curve.
- Growth Phase: At first, growth is slow, then it accelerates rapidly (Exponential).
- Inflection Point: The growth starts to slow down.
- Saturation Phase: The system hits a limit (carrying capacity). Adding more effort produces zero result.
Example in Business: A company spends money on ads. At first, sales boom. But eventually, everyone in the market has seen the ad. Spending another $1 million on ads (input) results in zero new customers (output). The market is saturated. A linear thinker would keep spending money, wasting resources, while a systems thinker knows the curve has flattened.
Why Models Fail
Nonlinearity is the primary reason why economic forecasts and project plans fail.
If you build a plan based on straight lines (linear projections), you are assuming the future will act exactly like the past.
- The Linear Prediction: “We grew by 10% last year, so we will grow by 10% this year.”
- The Nonlinear Reality: “We grew by 10% last year, but we just hit the tipping point of our warehouse capacity. If we grow 1% more, our logistics system will break, and we will lose money.”
System Dynamics models are specifically designed to include these curves and “lookup tables” to simulate how relationships change when limits are hit.
Conclusion
Nonlinearity is the rule of the real world. Whether it is the Tipping Point where a stable system suddenly crashes, or the Saturation point where a successful strategy hits a wall, these curves define our reality. By understanding that systems have hidden thresholds, we learn to stop assuming that tomorrow will be like today. We learn to look for the “straw” that might break the system before we add it.