Systems Thinking gives us powerful ways to see problems differently. One of the most useful tools in this approach is the Behavior Over Time Graph, which is often called a BOTG. This simple tool helps us stop just reacting to single events and start noticing patterns that tell a deeper story about a problem.
What is a BOTG? A BOTG is a simple graph that shows how a variable changes across a period of time. Instead of focusing on just one moment, it helps you see the whole trend. The horizontal line (x-axis) represents time. The vertical line (y-axis) represents the variable you are tracking, such as sales, customer satisfaction, or energy use. By looking at these graphs, you can quickly see if something is rising, falling, staying stable, or moving in cycles.
In short: A BOTG lets you see if a problem is just a one-time event or if it is part of a bigger, recurring pattern.
Why Use BOTGs in Systems Thinking?
Most people react to a single event, like a sales drop or a new customer complaint. But Systems Thinkers look for the patterns and the structures that are behind those events. BOTGs are a powerful tool for doing this. They help you:
- Identify Recurring Issues: See if a problem happens again and again.
- Spot Early Warning Signals: See a problem start to grow before it becomes a crisis.
- Understand the Effects of Past Actions: See how a decision you made in the past is affecting things now.
- Predict Possible Future Behavior: See where the current trend might be going.
For example, a company might worry about a sales drop this month. But a BOTG may show that sales have been slowly declining for years. This changes how you look at the problem. Instead of just trying a quick fix, you can start looking for a deeper issue.
Important: The greatest value of a BOTG is that it helps you shift your view from a single event to a long-term pattern. This shift is the first step toward finding a lasting solution.
Common Shapes in Behavior Over Time Graphs
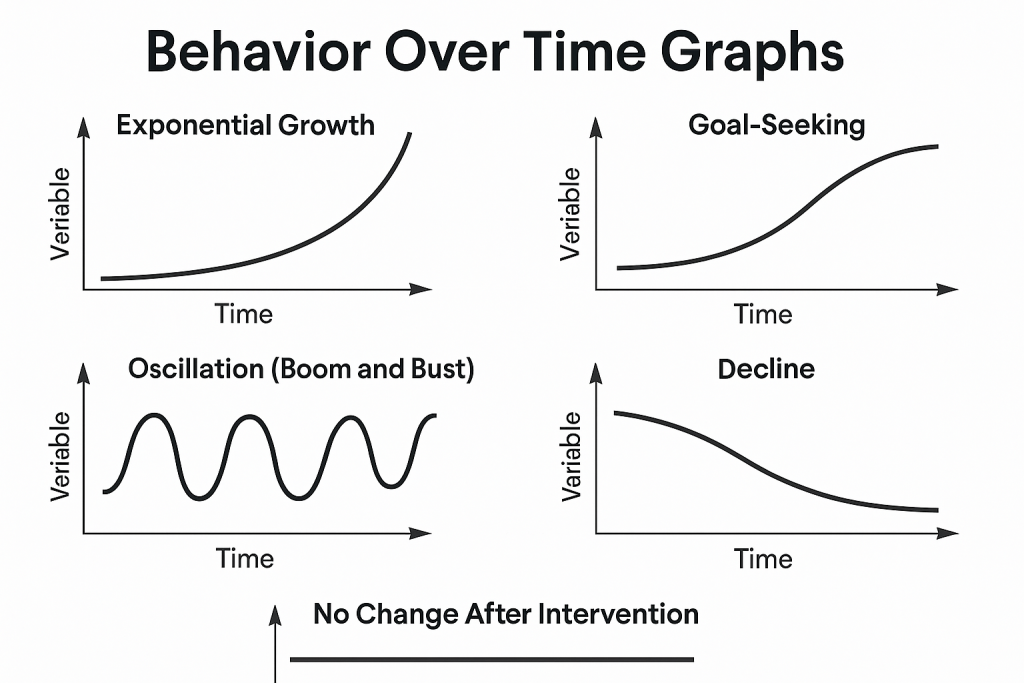
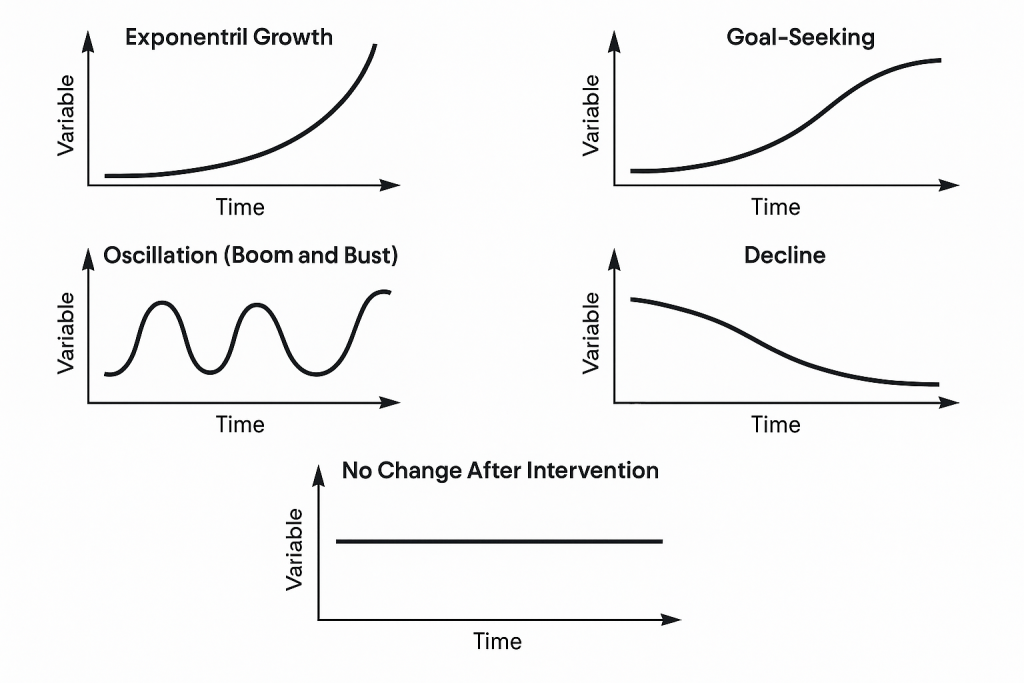
BOTGs often show recurring shapes. Each shape tells a specific story about how a system is behaving.
- Exponential Growth: This shape looks like a curve that moves sharply upward. It is a sign that something is growing very fast. A great example is a social media post that goes viral and gets a huge number of views in a short time.
- Goal-Seeking: This shape starts rising or falling quickly and then levels off. This shows a system that is trying to get to a specific goal and then holding that goal. A thermostat in a room is a good example; it turns the heat on or off to keep the temperature stable.
- Oscillation (Boom and Bust): This shape goes up and down in waves. This shows a repeating cycle in the system. Product demand rising during a holiday season and then dropping afterward is a good example of this shape.
- Decline: This shape shows a steady or rapid decrease. It is a sign that a problem is getting worse. A company’s customer base shrinking after bad service experiences would show up as a decline on a BOTG.
- No Change After Intervention: This shape looks like a flat line, even after an action has been taken. This is a sign that a solution you tried had no effect on the problem at all.
How to Create a BOTG
Making a BOTG is simple. You don’t need special software; a pencil and paper are enough.
- Choose the Variable: Pick the one thing you want to study, such as employee turnover, customer satisfaction, or revenue.
- Define the Time Frame: Decide on the time frame you need to see the pattern clearly. This could be weeks, months, or even years.
- Plot the Data: Plot the data you already have, or simply sketch what you think has happened over that time.
- Look for the Shape: Is the shape rising, falling, moving in waves, or staying flat?
- Ask Why: The most important step is to ask why that shape exists. This is the bridge that takes you from seeing a pattern to doing a deeper system analysis.
For example, imagine your company has high employee turnover. A BOTG of turnover rates over the last five years may show a steady increase. That shape points to a deeper structural issue, such as declining morale or a lack of career growth. By seeing the pattern, leaders can look for the root causes of the problem, not just the symptoms.
Frequently Asked Questions (FAQs)
1. What is the difference between a BOTG and a regular business chart?
A regular business chart often shows only a single point in time, like this month’s sales. A BOTG focuses on the trend over a long period. This helps you see the story behind the numbers, not just the numbers themselves.
2. Can I use a BOTG for my personal life?
Yes, absolutely. You can use a BOTG to track your spending over months, your mood over weeks, or your study time over a semester. Seeing the pattern can help you understand your own habits and make better choices.
3. What if my data is not perfect?
It’s okay. The point of a BOTG is not to have perfect data. The point is to sketch the general trend so you can see the overall pattern. A rough sketch is often good enough to help you find the most important questions to ask.
4. Can a BOTG show a cause-and-effect relationship?
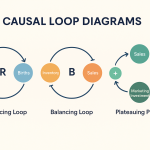
No, a BOTG shows only a pattern over time. It can suggest that two things are connected, but it does not prove it. To show a true cause-and-effect relationship, you need to use a Causal Loop Diagram to map out the connections.
5. Why is the “Why” step so important?
The “Why” step is the most important part because it forces you to think like a Systems Thinker. It moves you from just seeing a problem to asking about the structure and connections that are causing it.
Conclusion
A Behavior Over Time Graph is a simple but powerful tool for any Systems Thinker. It helps you move past the chaos of daily events and see the patterns that are the key to understanding a system. By learning to create and read a BOTG, you can start asking better questions and find a more lasting solution to any problem.